Case Study.
Transforming Carbon Accounting:
From a Spreadsheet Jungle to an Automated SaaS Platform

Overview
Transform a start-up’s manual workflows to an automated platform, allowing the business to scale rapidly

Figma & Figjam

Notion
When the copy-paste economy is holding back your growth
Picture this: It's 2023, and carbon accountants are still juggling dozens of spreadsheets, manually copying data between systems, and hoping they haven't made a calculation error that could cost their clients millions. Meanwhile, regulatory demands are intensifying, clients expect real-time insights, and the team is drowning in manual processes that simply don't scale.
Sound familiar?
This is the challenge I tackled when I was brought in to completely reimagine how carbon accounting workflows could be automated.
My approach
Unpick the business reason
Designing beautiful products can be fun, but designing beautiful products that are the crucial step in scaling the business - now that's what I thrive on.
The business couldn't take on new clients without hiring exponentially more staff
Get under the hood
I don't believe in designing from an ivory tower. So I rolled up my sleeves and embedded myself with the teams doing the actual work.
Watching carbon accounting consultants work was like watching a masterclass in creative problem-solving - and a horror show of inefficiency. These brilliant professionals were spending 60% of their time on data wrangling (and swearing at Excel spreadsheets) instead of the strategic analysis their clients actually valued.
Workflow complexities
Complex handoffs between team members created single points of failure
Customer communication gaps
Clients had no visibility into project progress, leading to constant status update requests
Knowledge silos
Critical process knowledge lived in people's heads, not systems
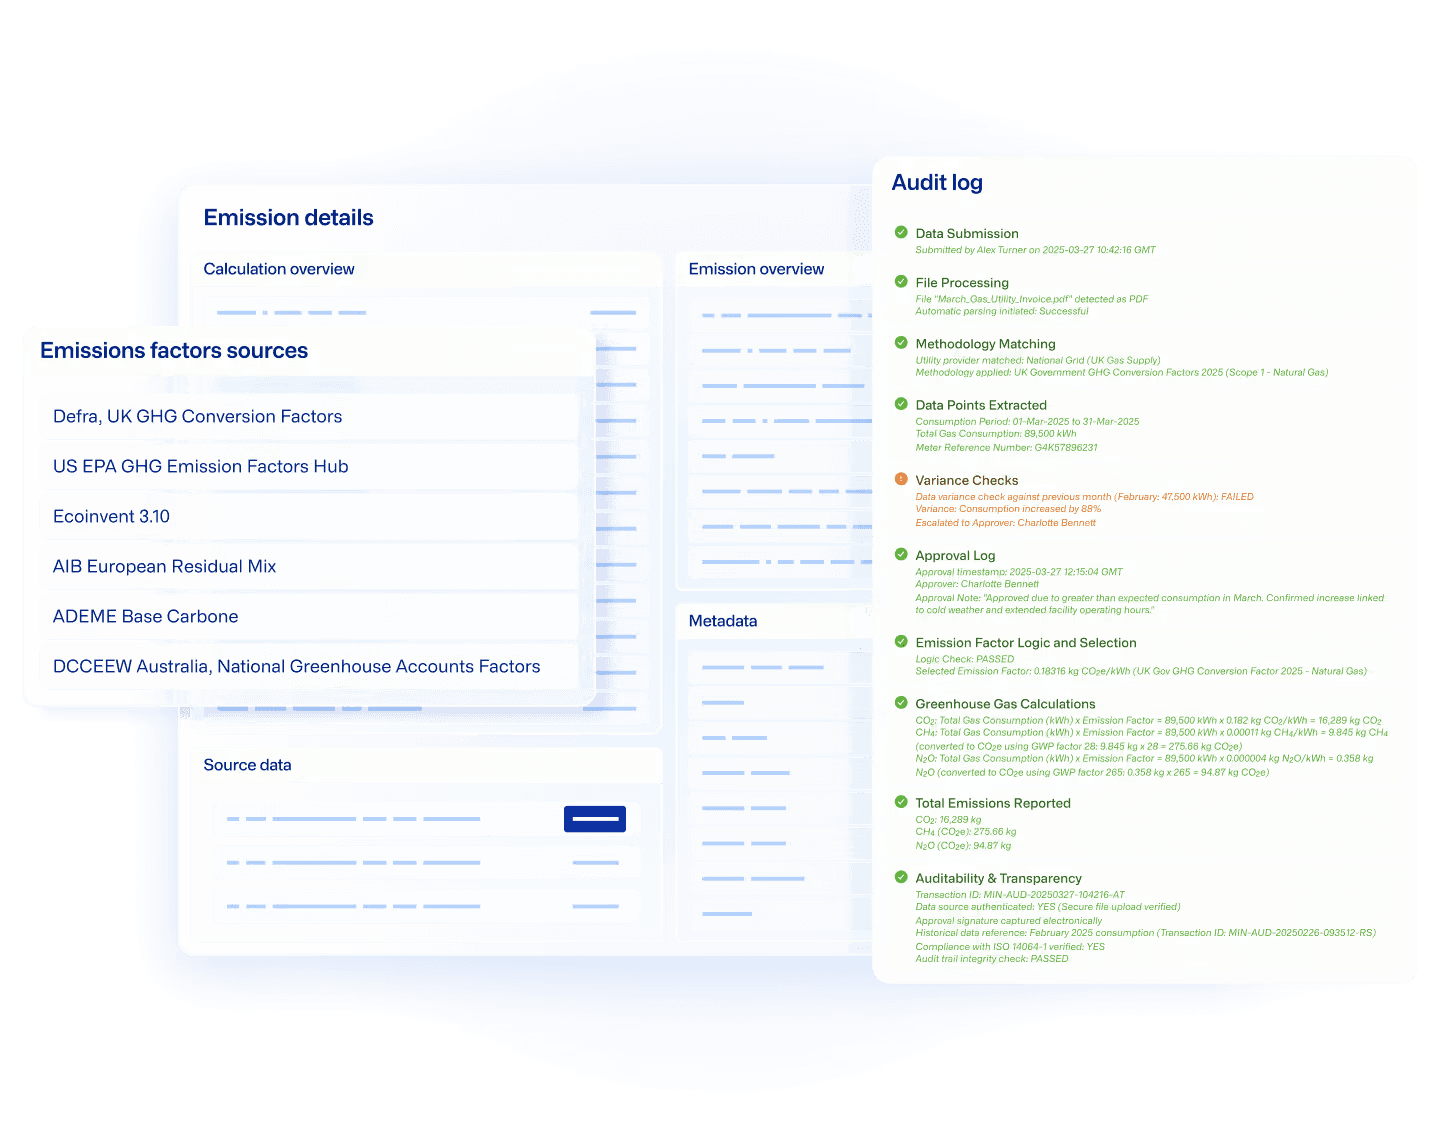
Compliance stress
Manual audit trail creation was consuming entire days per project
Mapping the Mess: Current State Analysis
I created comprehensive service blueprints that revealed the true scope of the challenge. To ensure all of my findings were accurately representing the process and pain-points, I validated the blueprints and resulting data models in a series of workshops with the internal team.
What looked like a simple "carbon accounting process" was actually a complex web of:
distinct process steps
handoff points
different customer communication touch-points with inconsistent messaging
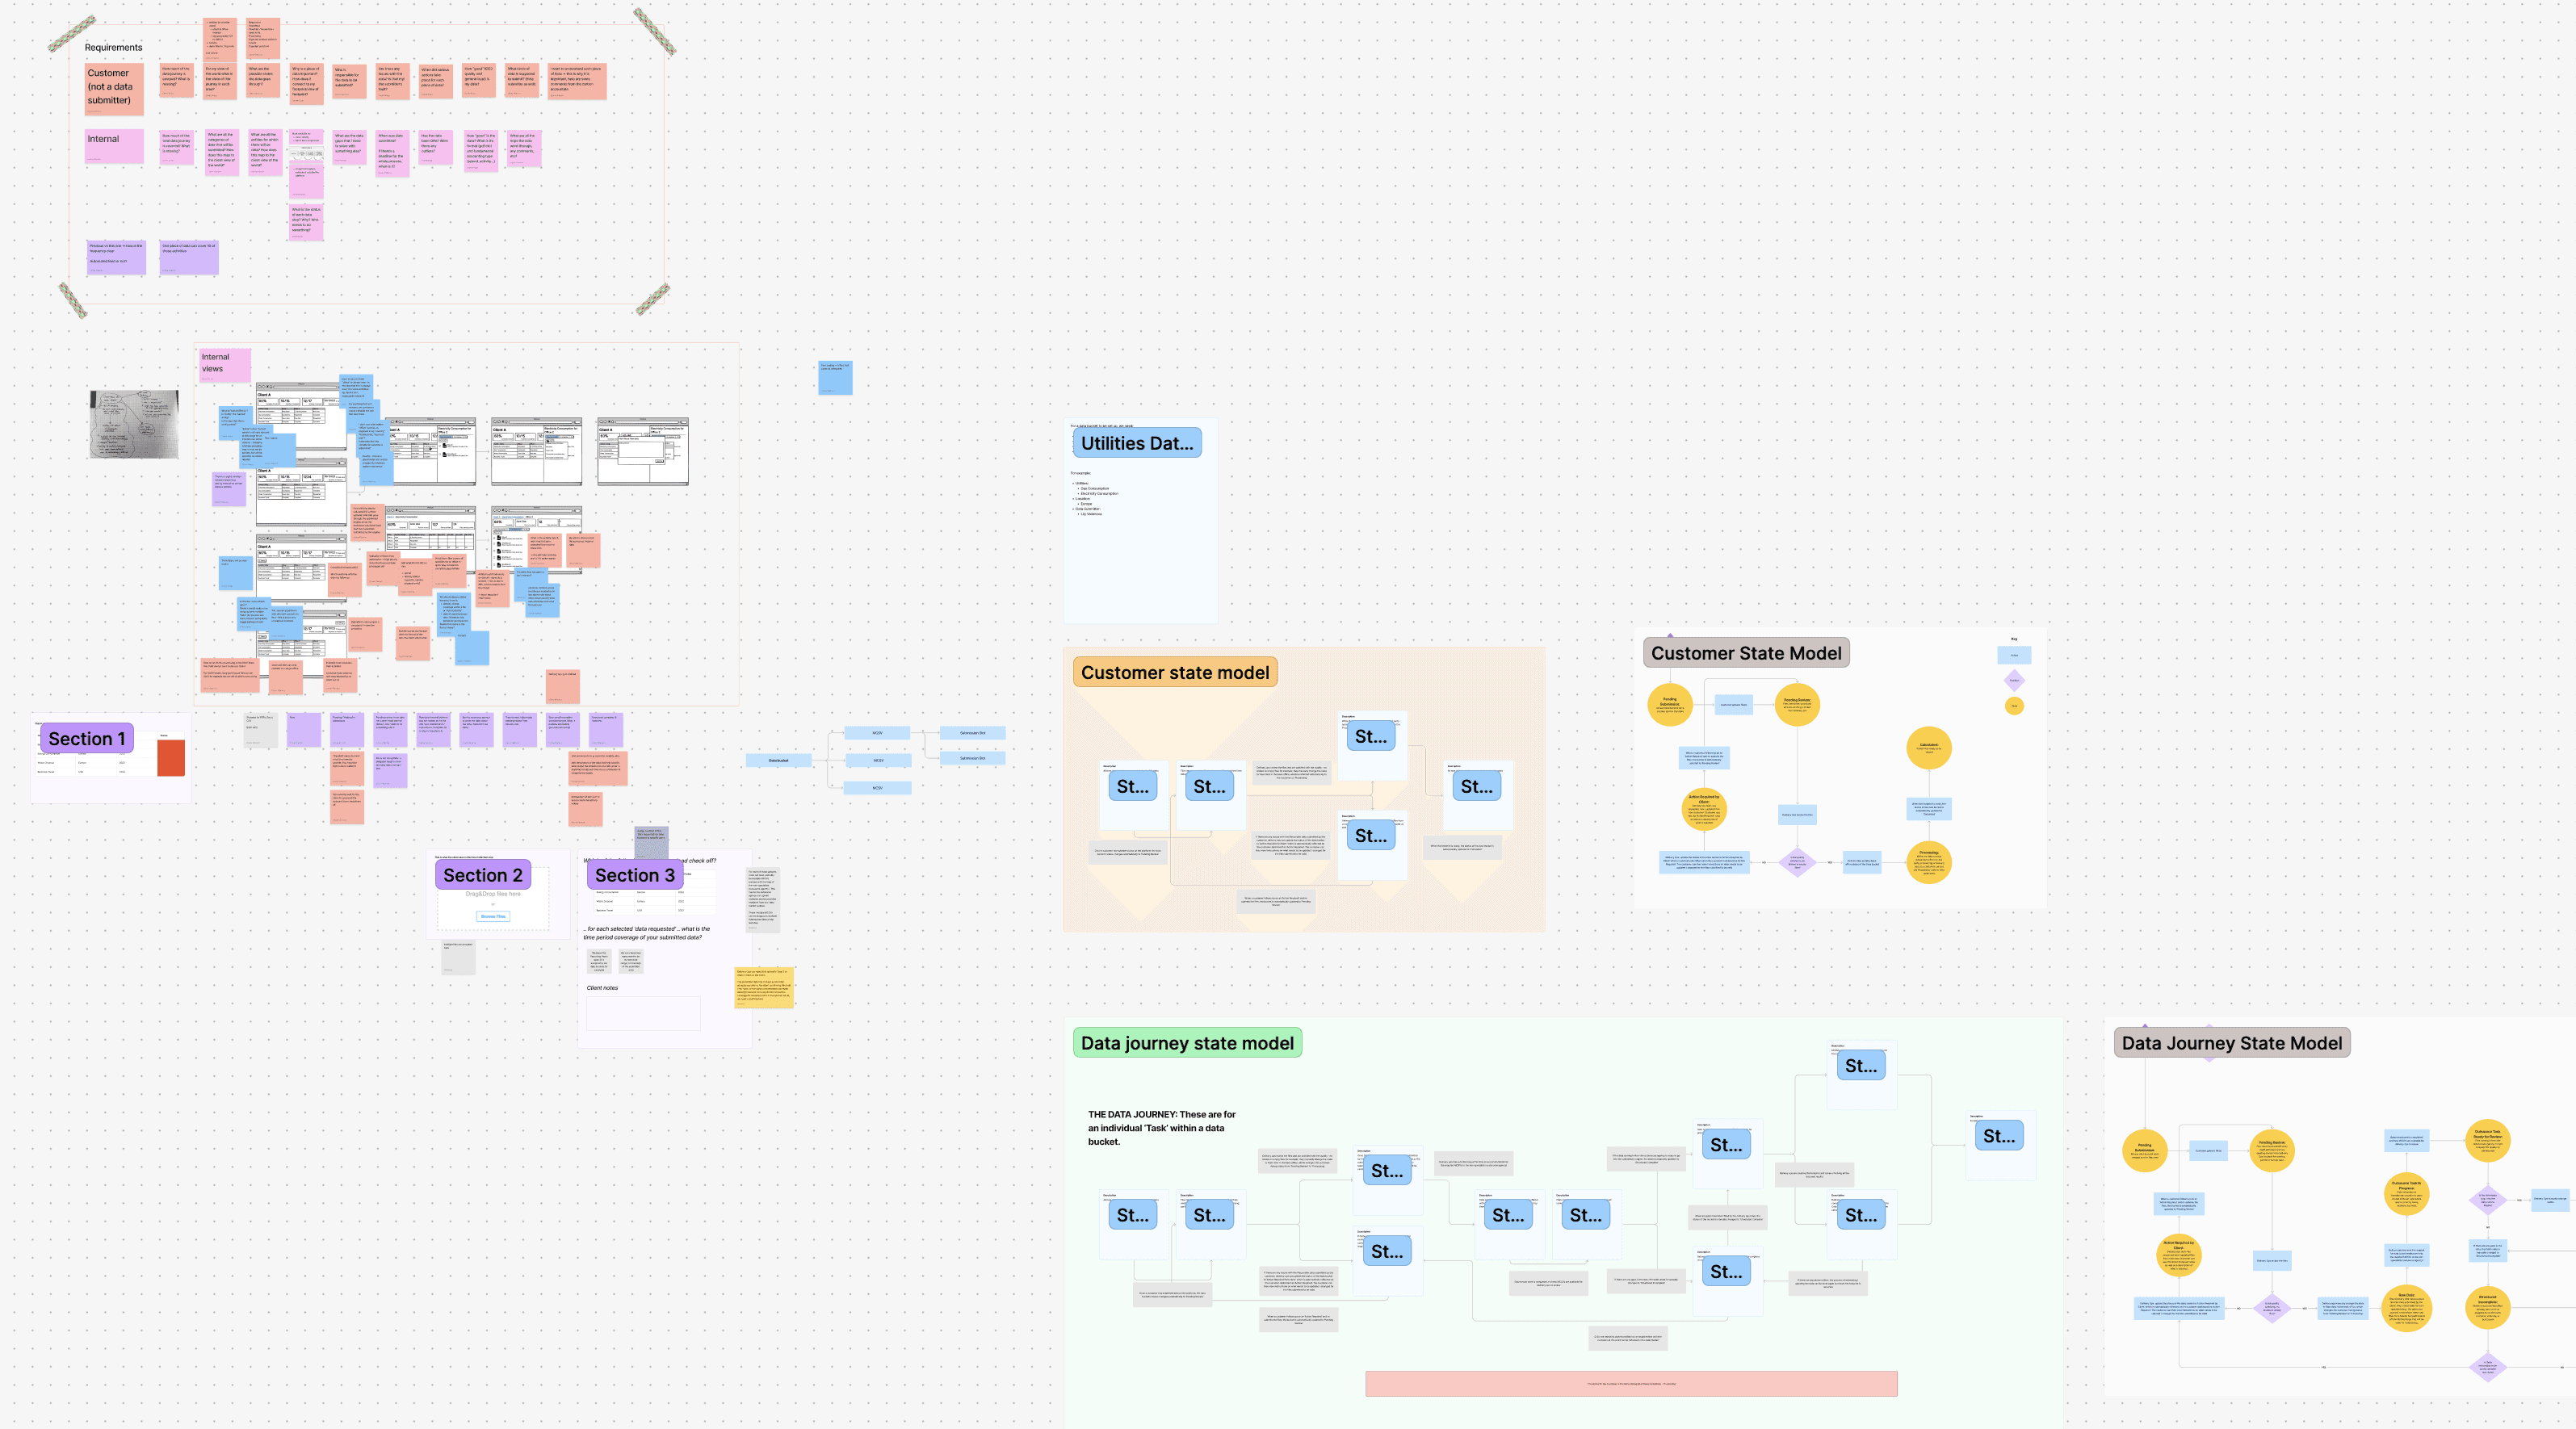
The visualisation was shocking. Even to the team who lived this reality daily.
Rapid low-fidelity iteration
One of my most favourite tools to utilise when designing a solution for a complex problem are low-fidelity, usually hand-drawn wireframes, allowing for large number of ideas to be tested thus reaching the most elegant solution fast.
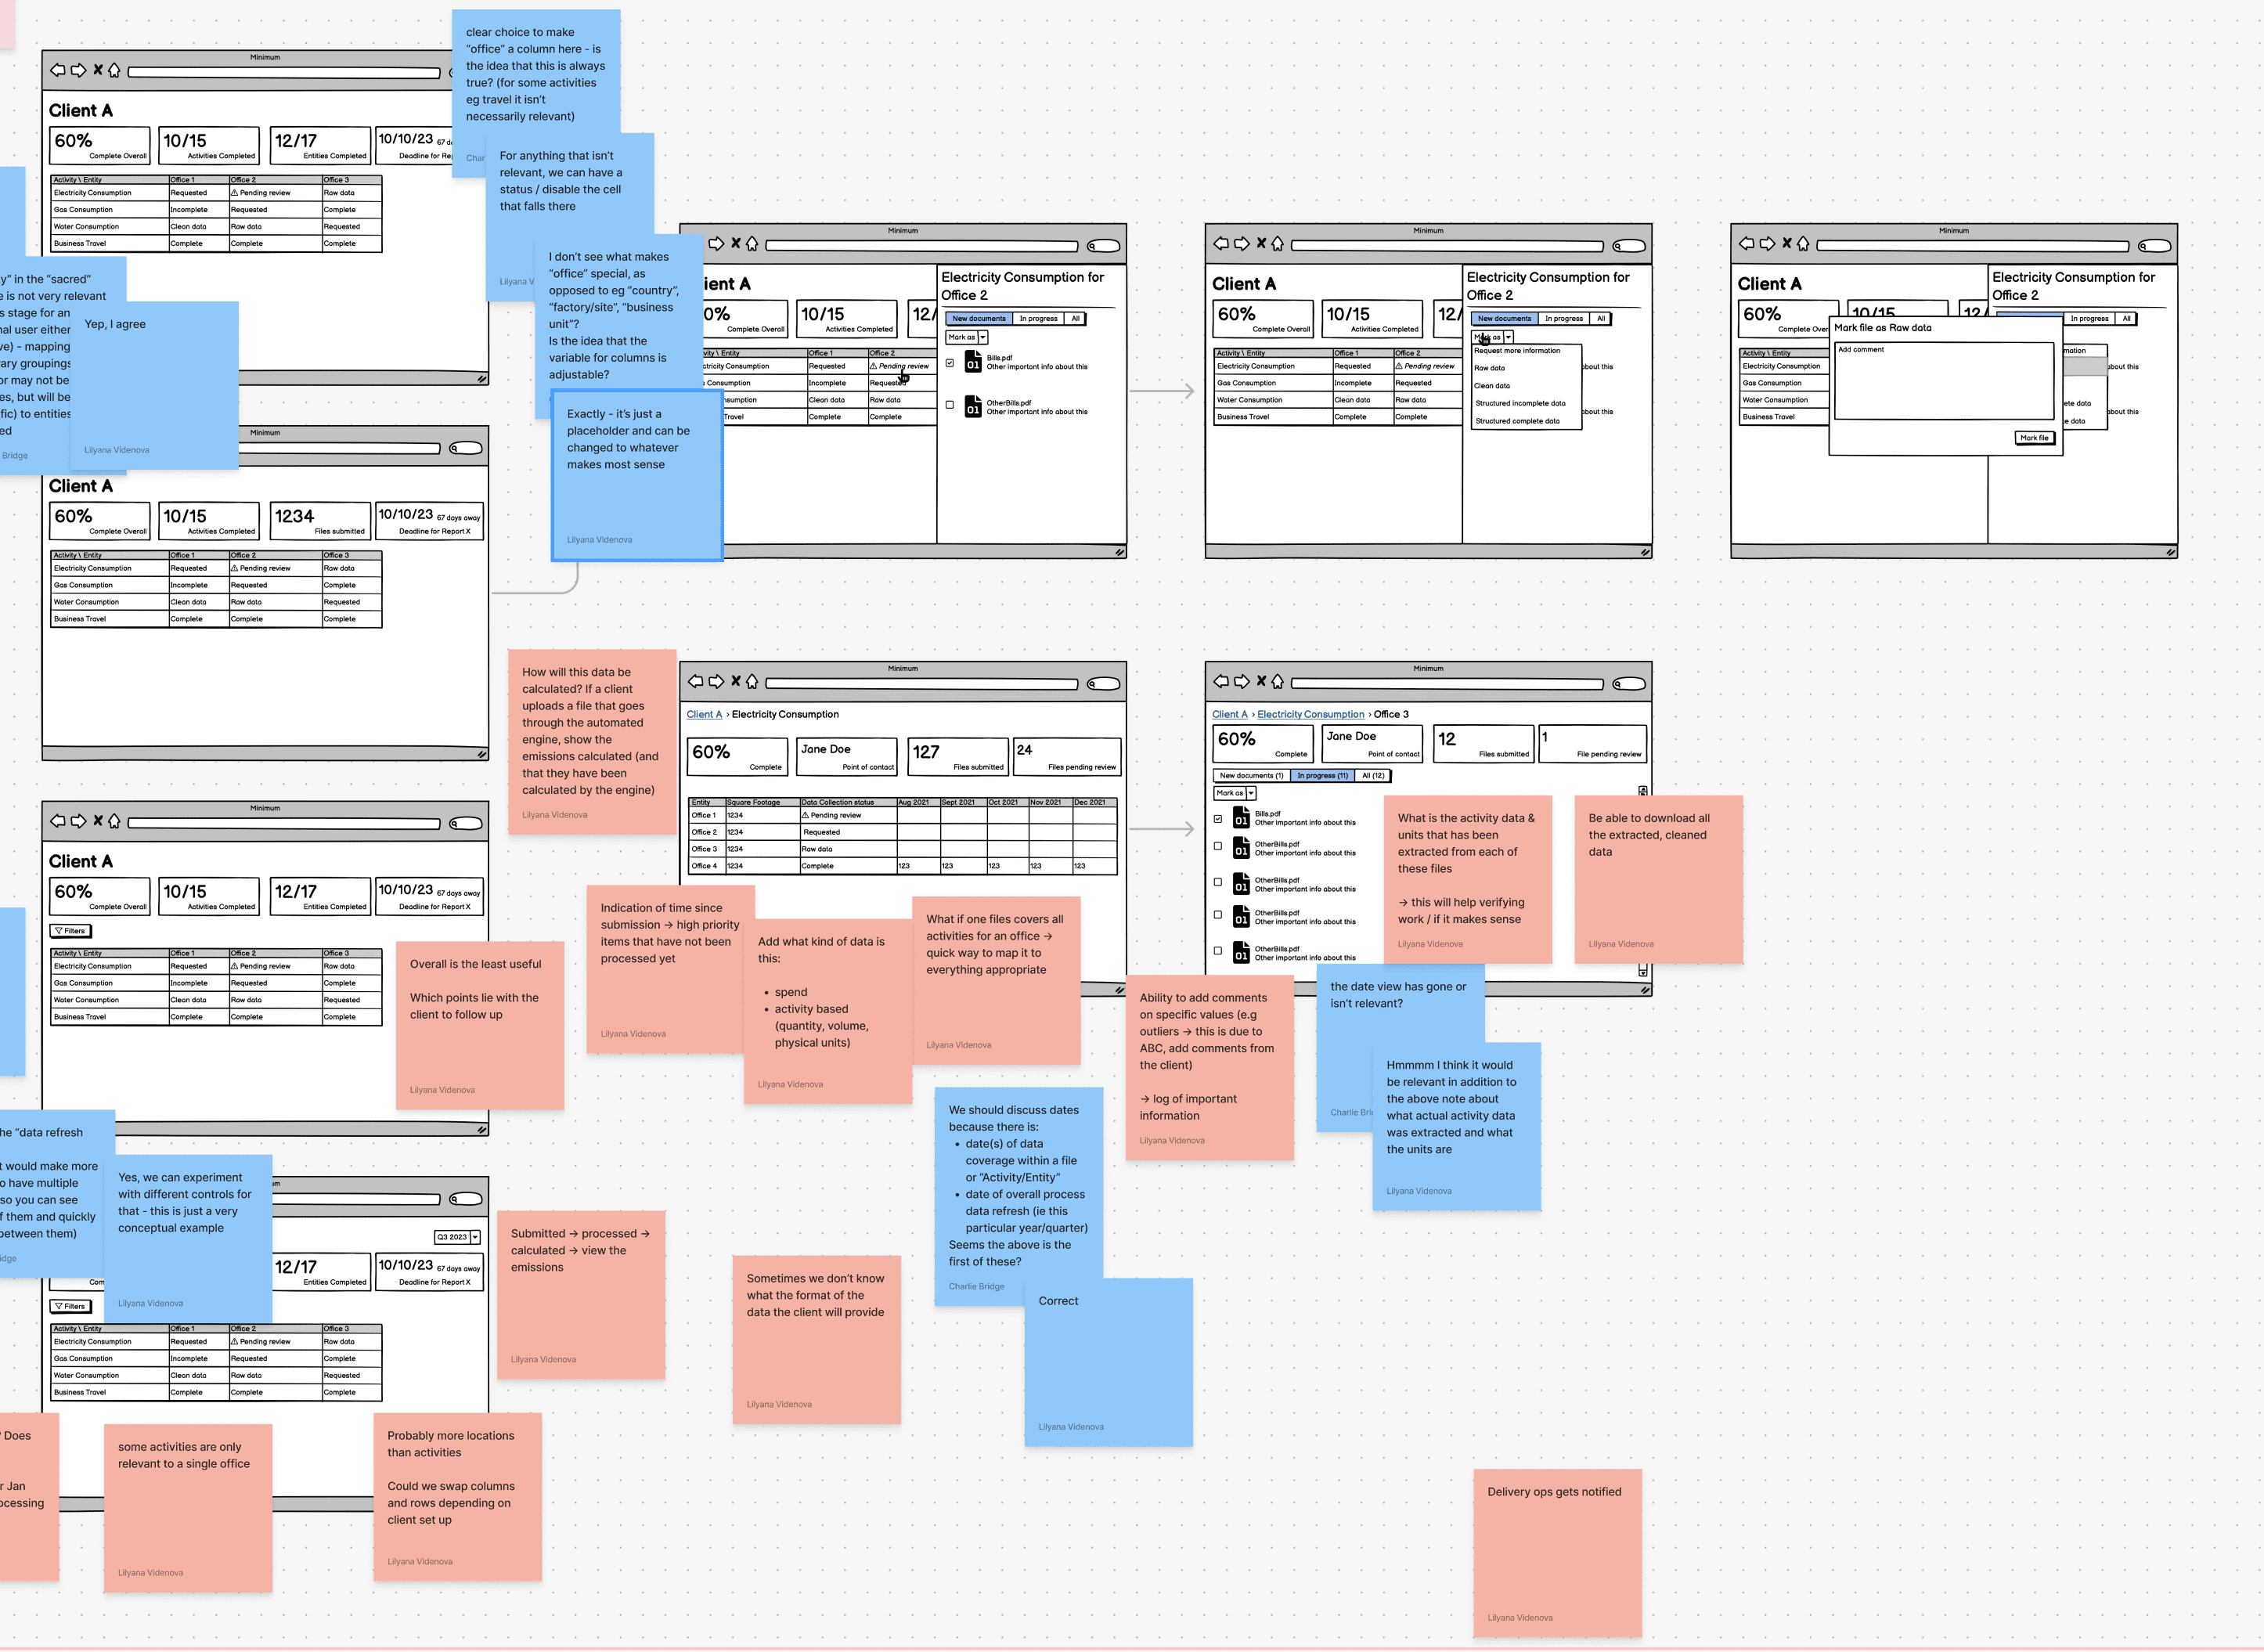
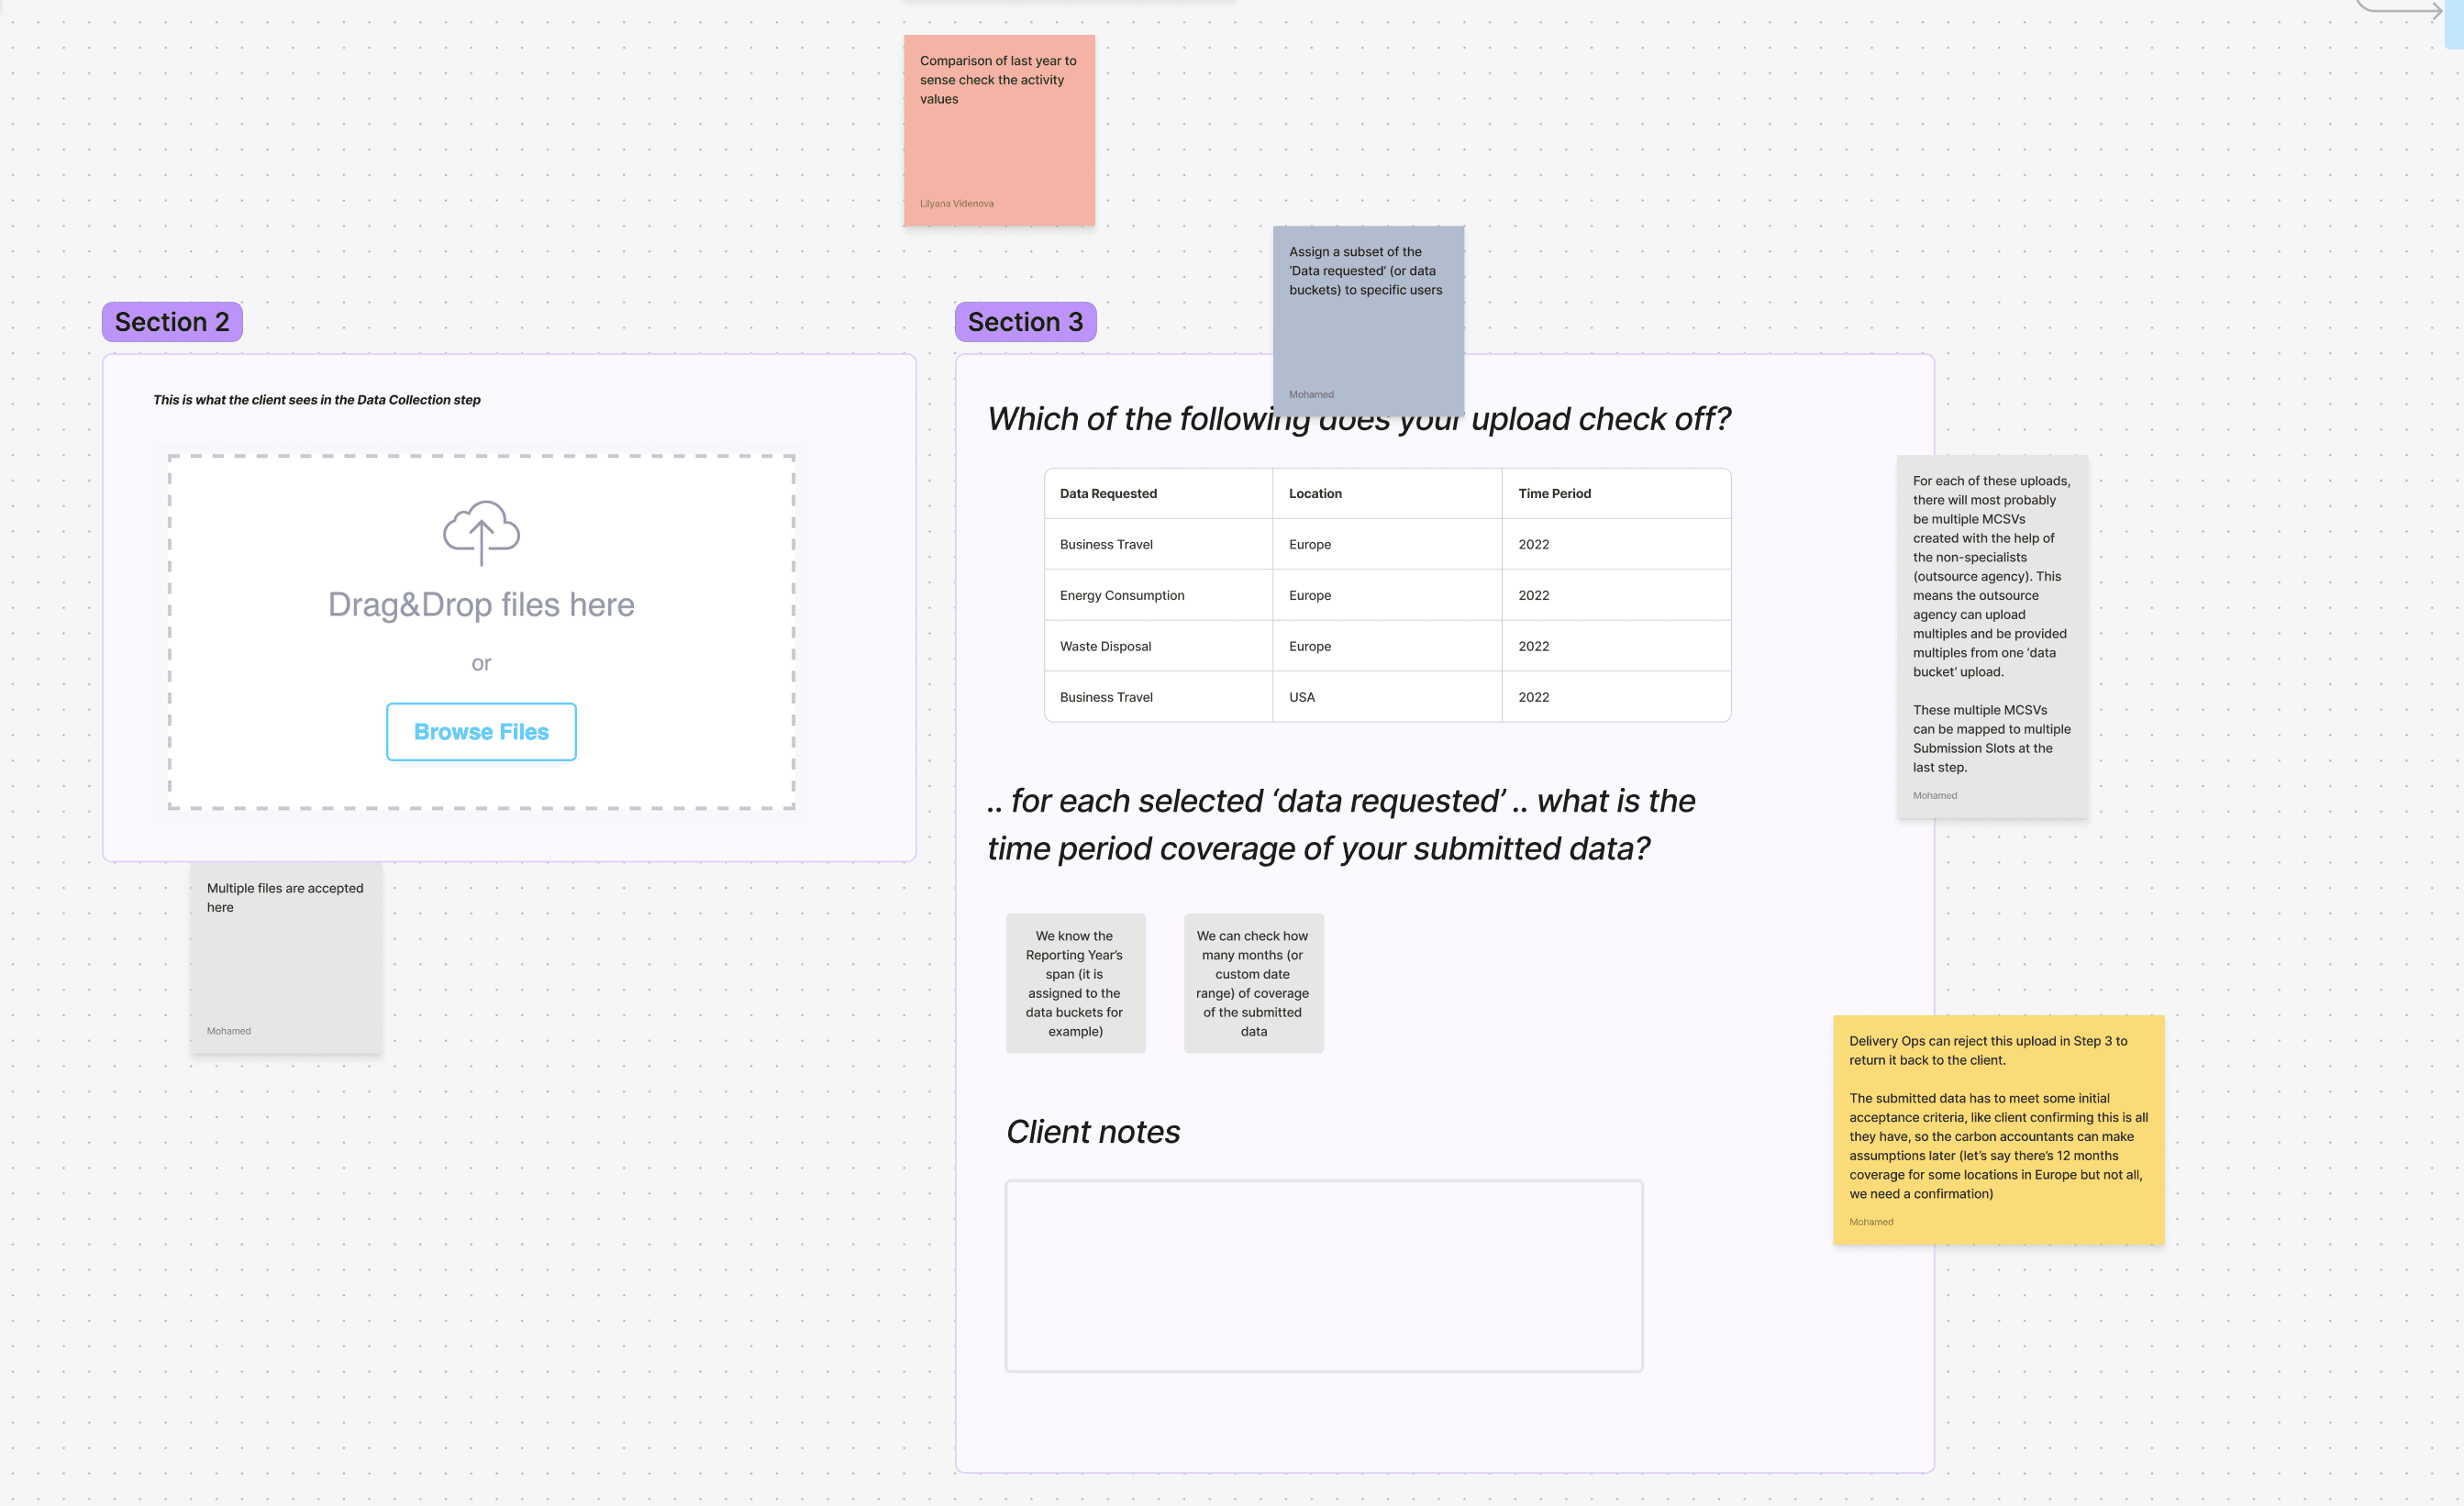
This might appear as to be a rather slow process, however I completed the work described in this section in just under one month, delivering current and future state service blueprints, data models, user flows, and an interactive prototype, all of which acted as the basis of the following solution.
The Solution: Intelligent Automation with Human Insight
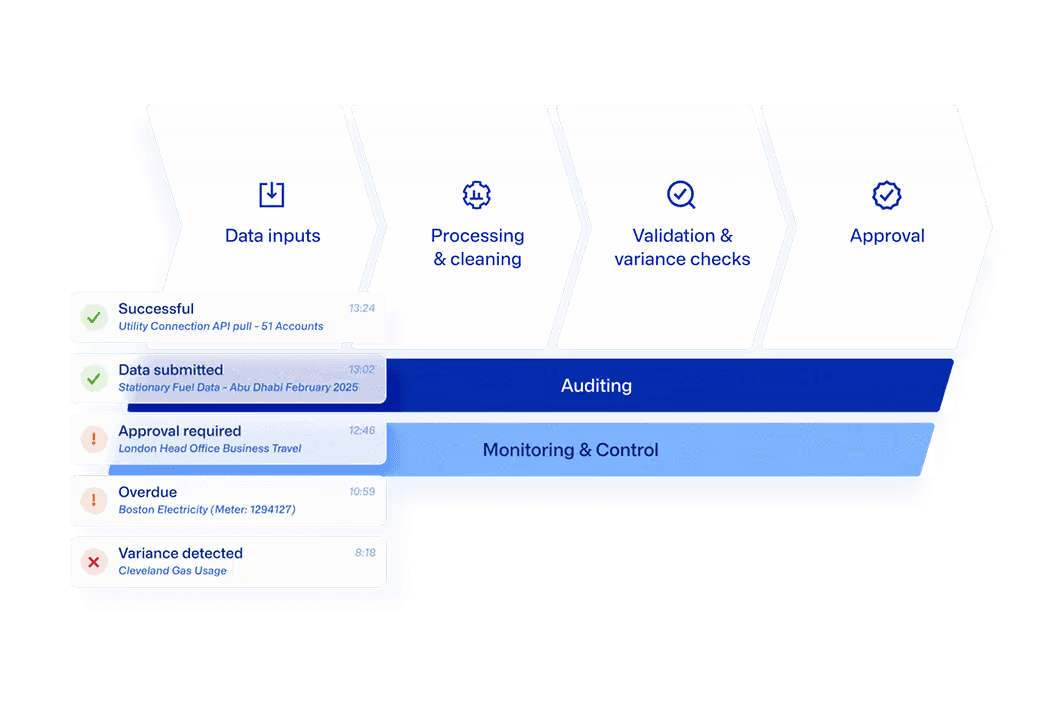
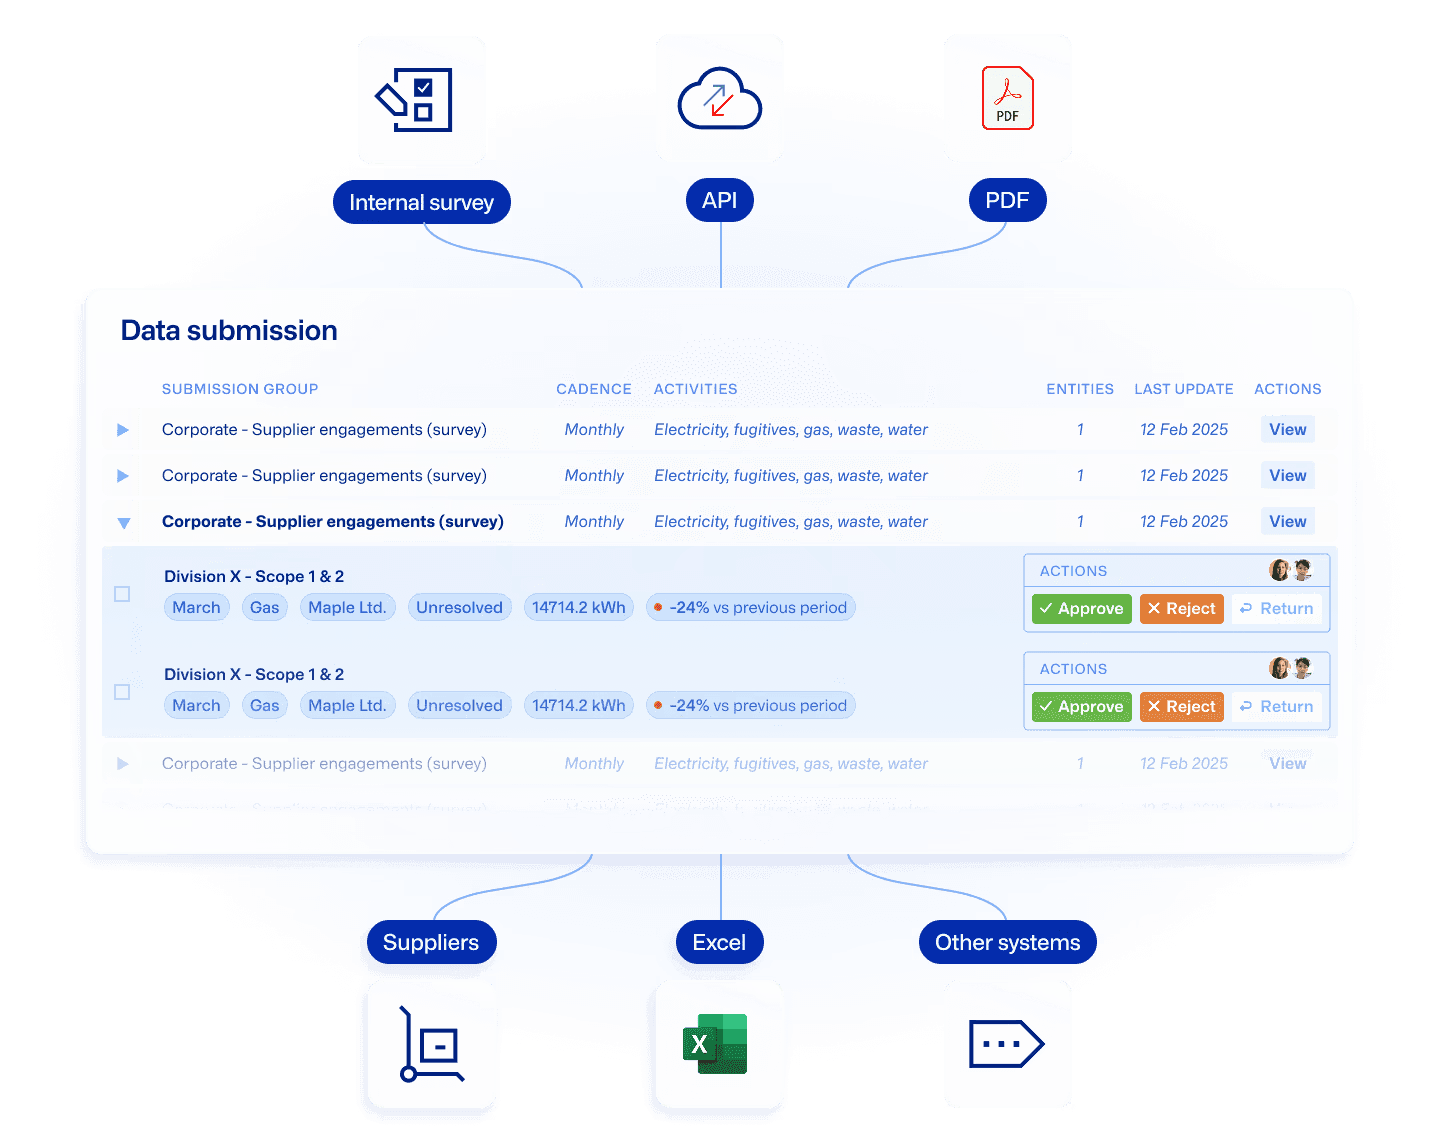
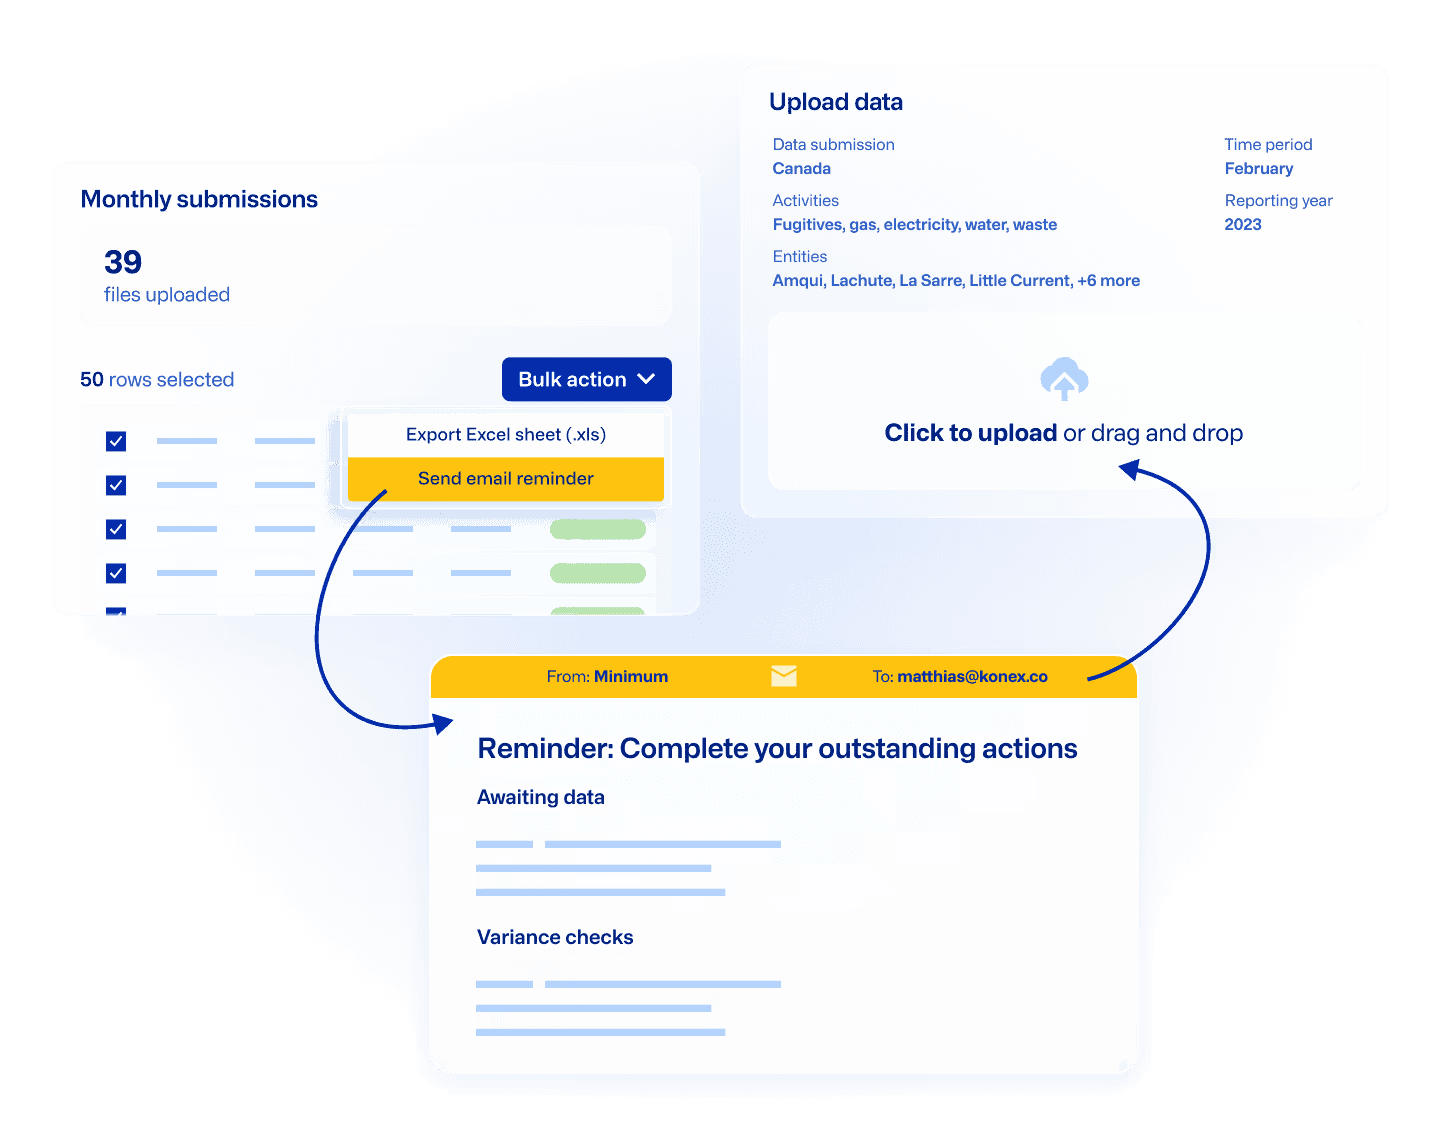
Before: Clients submitted data and waited weeks for updates
After
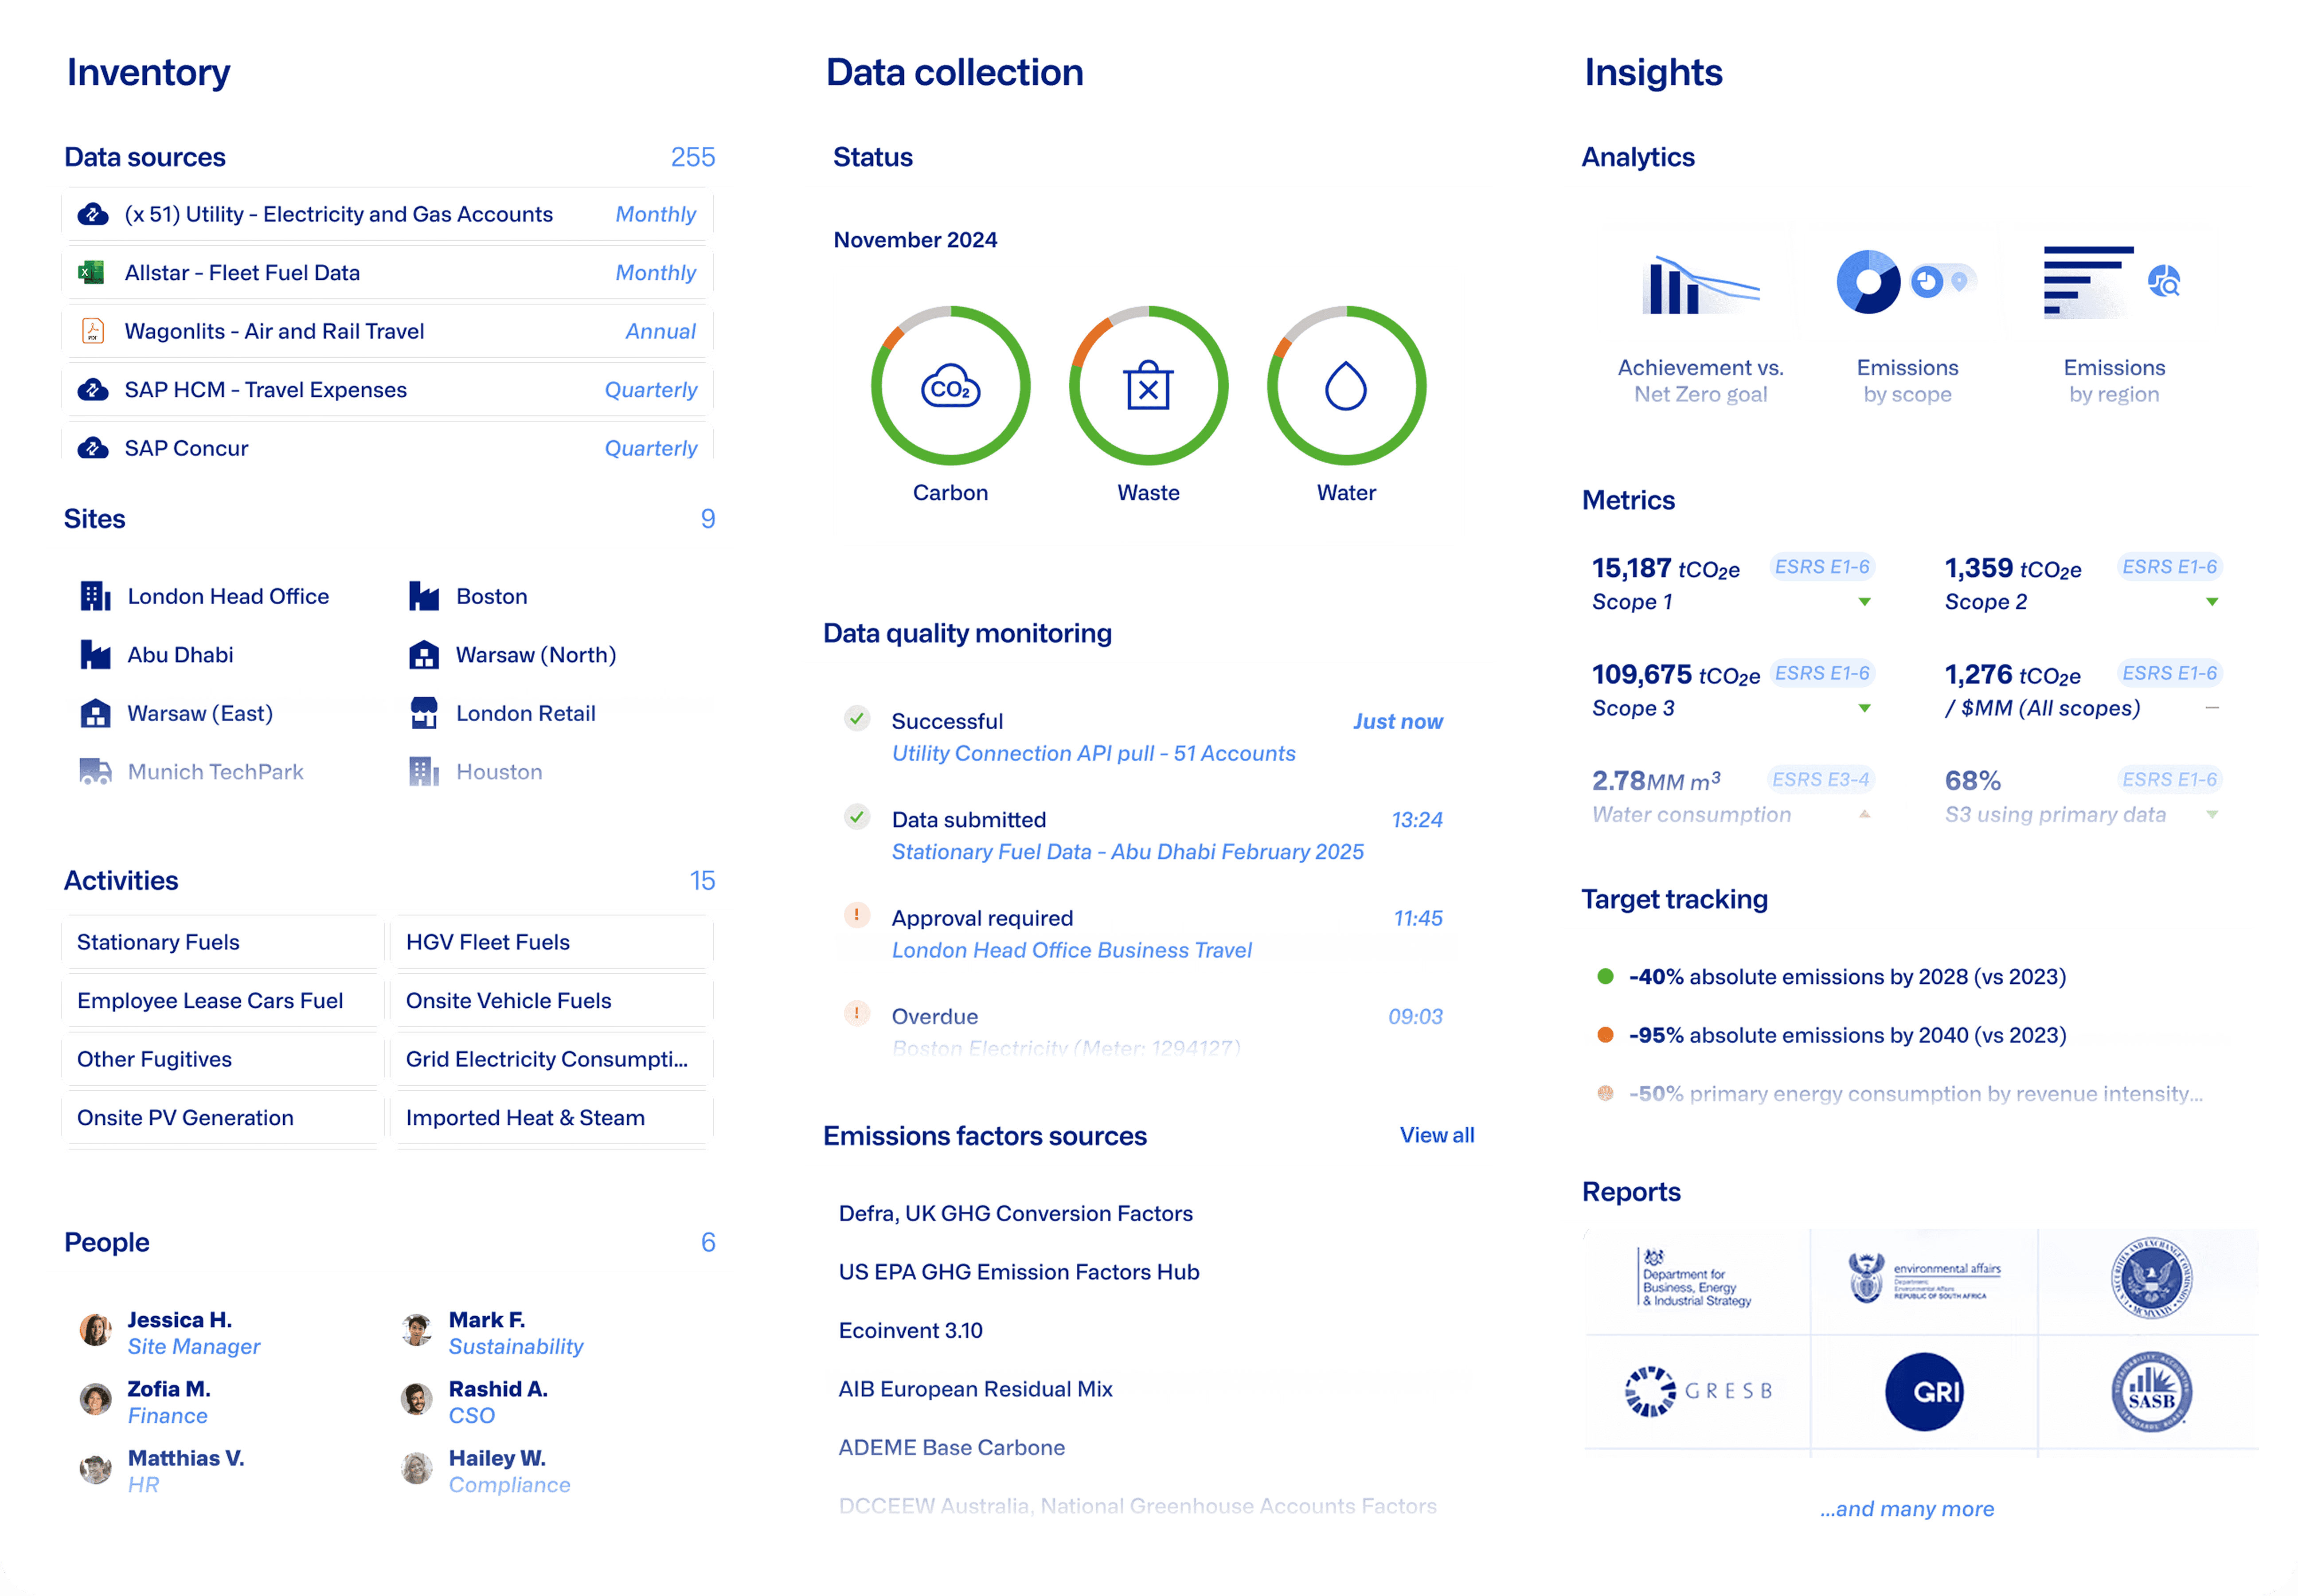
Project Dashboard
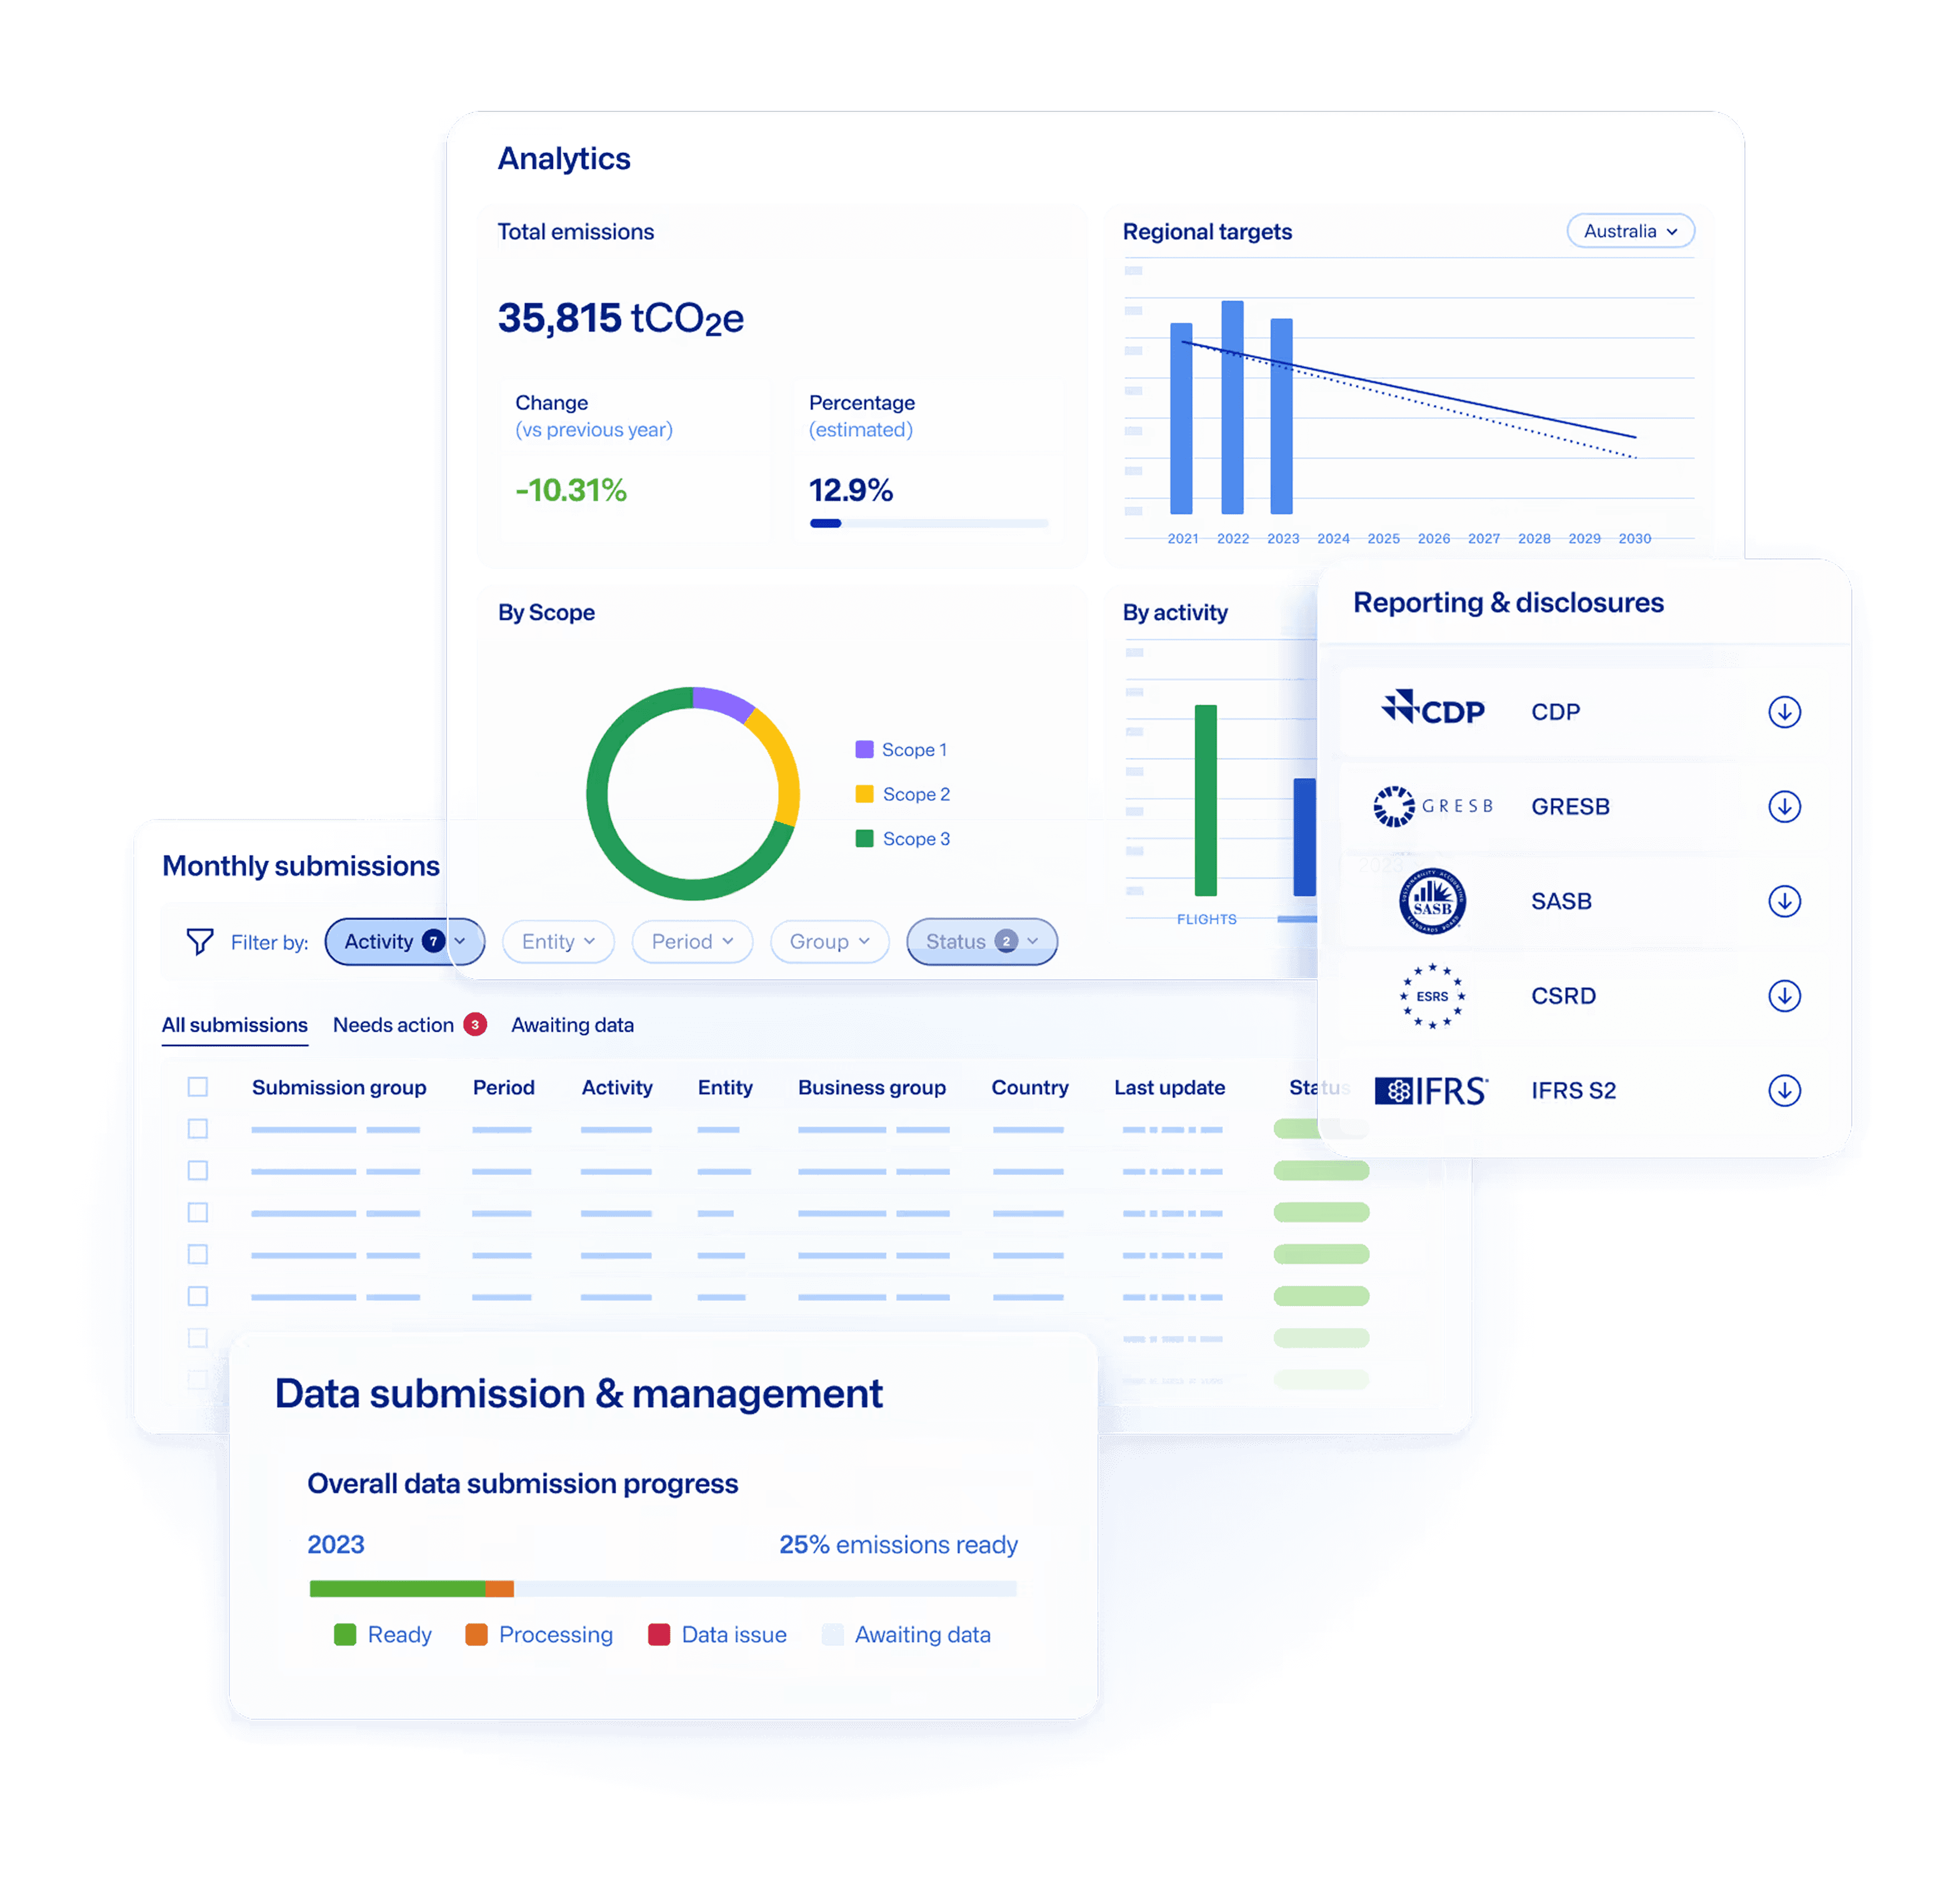
Self Service Reports
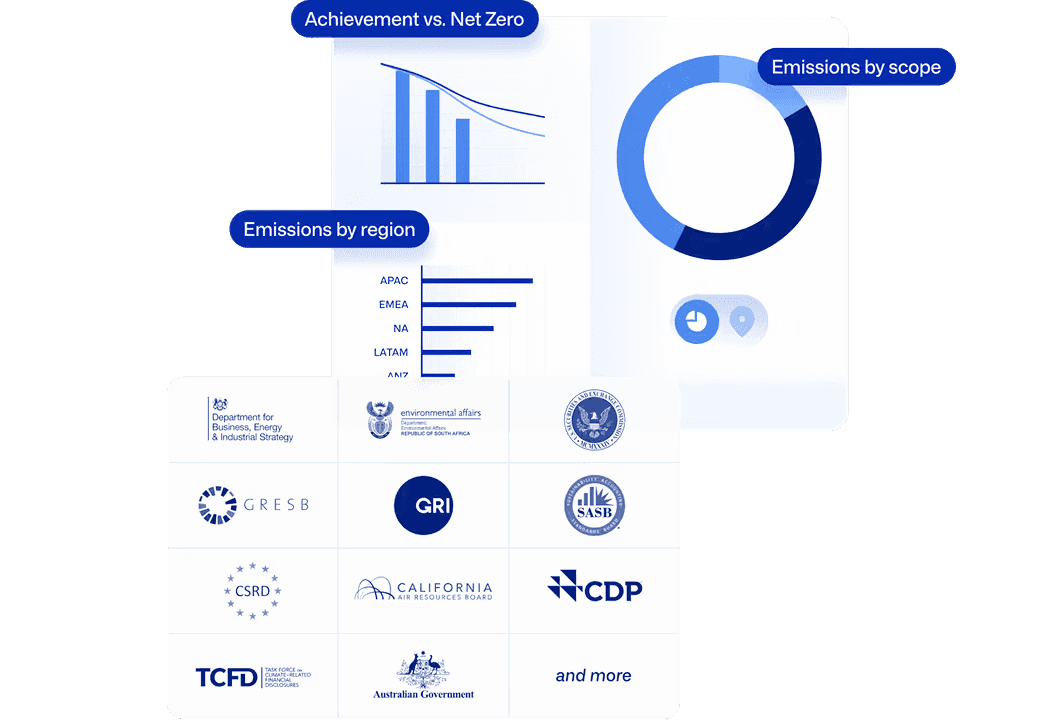
Interactive Data Visualisation
What made this work
Collaboration was the key
User-Centred Design
Migration Strategy as Product Design
Continuous Validation & Iteration
What I Learned
Early and Continuous Customer Communication
Keeping clients informed throughout the migration process turned potential anxiety into excitement about improvements.
Cross-Functional Validation
Having technical, operations, and compliance teams validate every design decision prevented costly mistakes and ensured feasibility.
Whether you're dealing with regulatory compliance, manual processes, or scaling challenges, I specialise in designing solutions that respect the human expertise whilst dramatically improving efficiency.
What I bring:
I'm currently available for new projects and would love to explore how user-centred design can solve your most pressing challenges.